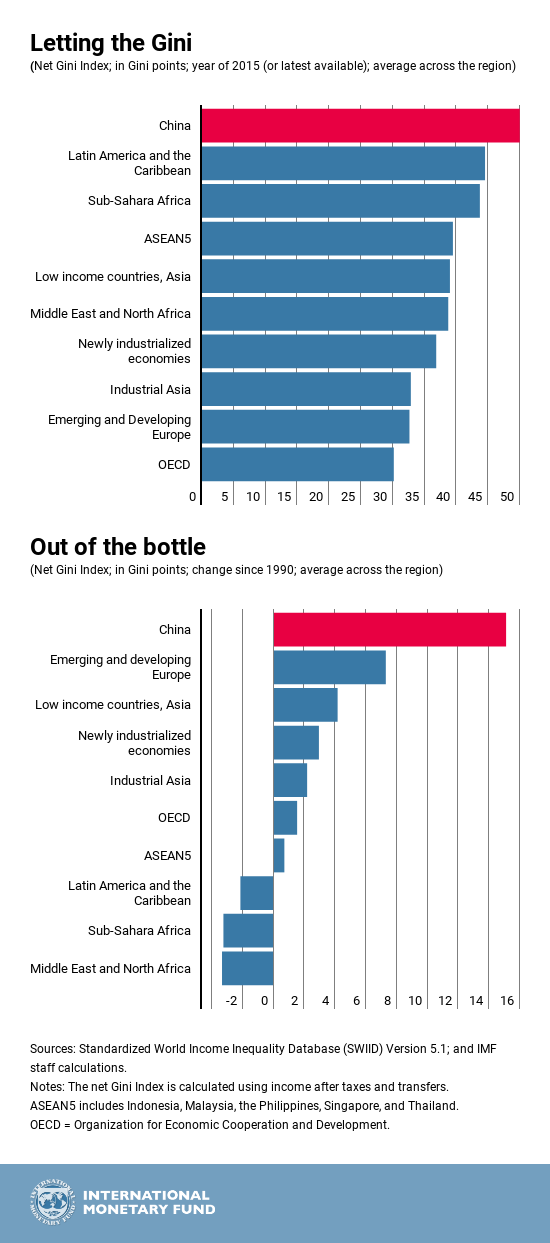
Chinese success in reducing absolute poverty is stunning: between 1981 and 2004, the number of people living in poverty shrank by 600 million. The reduction came as a result of remarkable policy reforms in the country which moved it away from an economy that was almost completely controlled by the central government toward one that allowed private ownership of property and reliance on market forces to determine wages and prices. But even while absolute poverty was being reduced, relative poverty was increased. We measure income inequality by a measure called the Gini coefficient where a value of zero means that everyone receives the same income and a value of 1 means that only one person has all the income in a society. By looking at the Gini coefficient, income inequality in China has gotten worse even as the economy has grown substantially.
If one needs data about the US economy, the Federal Reserve Bank publishes a statistical quarterly, Financial Accounts of the United States, which contains more information that one can reasonably process. In the report released today, the Federal Reserve noted that:
The net worth of households and nonprofits rose to $106.9 trillion during the second quarter of 2018. The value of directly and indirectly held corporate equities increased $0.8 trillion and the value of real estate increased $0.6 trillion.

In 2008, the net worth of all Americans was $58,908 trillion. The increase in 10 years is absolutely amazing–almost doubling.
Unfortunately, although this increase in wealth is impressive, it is not widely shared by all Americans. Indeed, most of the wealth seems to be accumulating in the hands of just a few individuals. The graph below was produced by Deutsche Bank and its timeline ends in 103, but there is no reason to believe that the trendline from the 1980s has changed at all and it is highly likely that the lines are now crossed in the same manner as they were prior to the Great Depression of the 1930s.

The Congressional Budget Office produced this graph which shows that the increase for the bottom 50% of the US population since the 1980s has been negligible.

The US economy is clearly growing but the growth is increasingly concentrated in the hands of a very few individuals.

Leave a comment